
Free download
Simple LUT Tester
A single PNG that tells you whether a LUT puts colour where it belongs — or quietly moves it somewhere else. Works with any camera, any log format.
Drop it on your timeline, apply the LUT, look at your vectorscope. Six corners on their marks means the LUT is placing colour correctly. Corners flung off means it isn't, and no amount of grading will put that back.
Simple LUT Tester 16-bit PNG · 1920×1080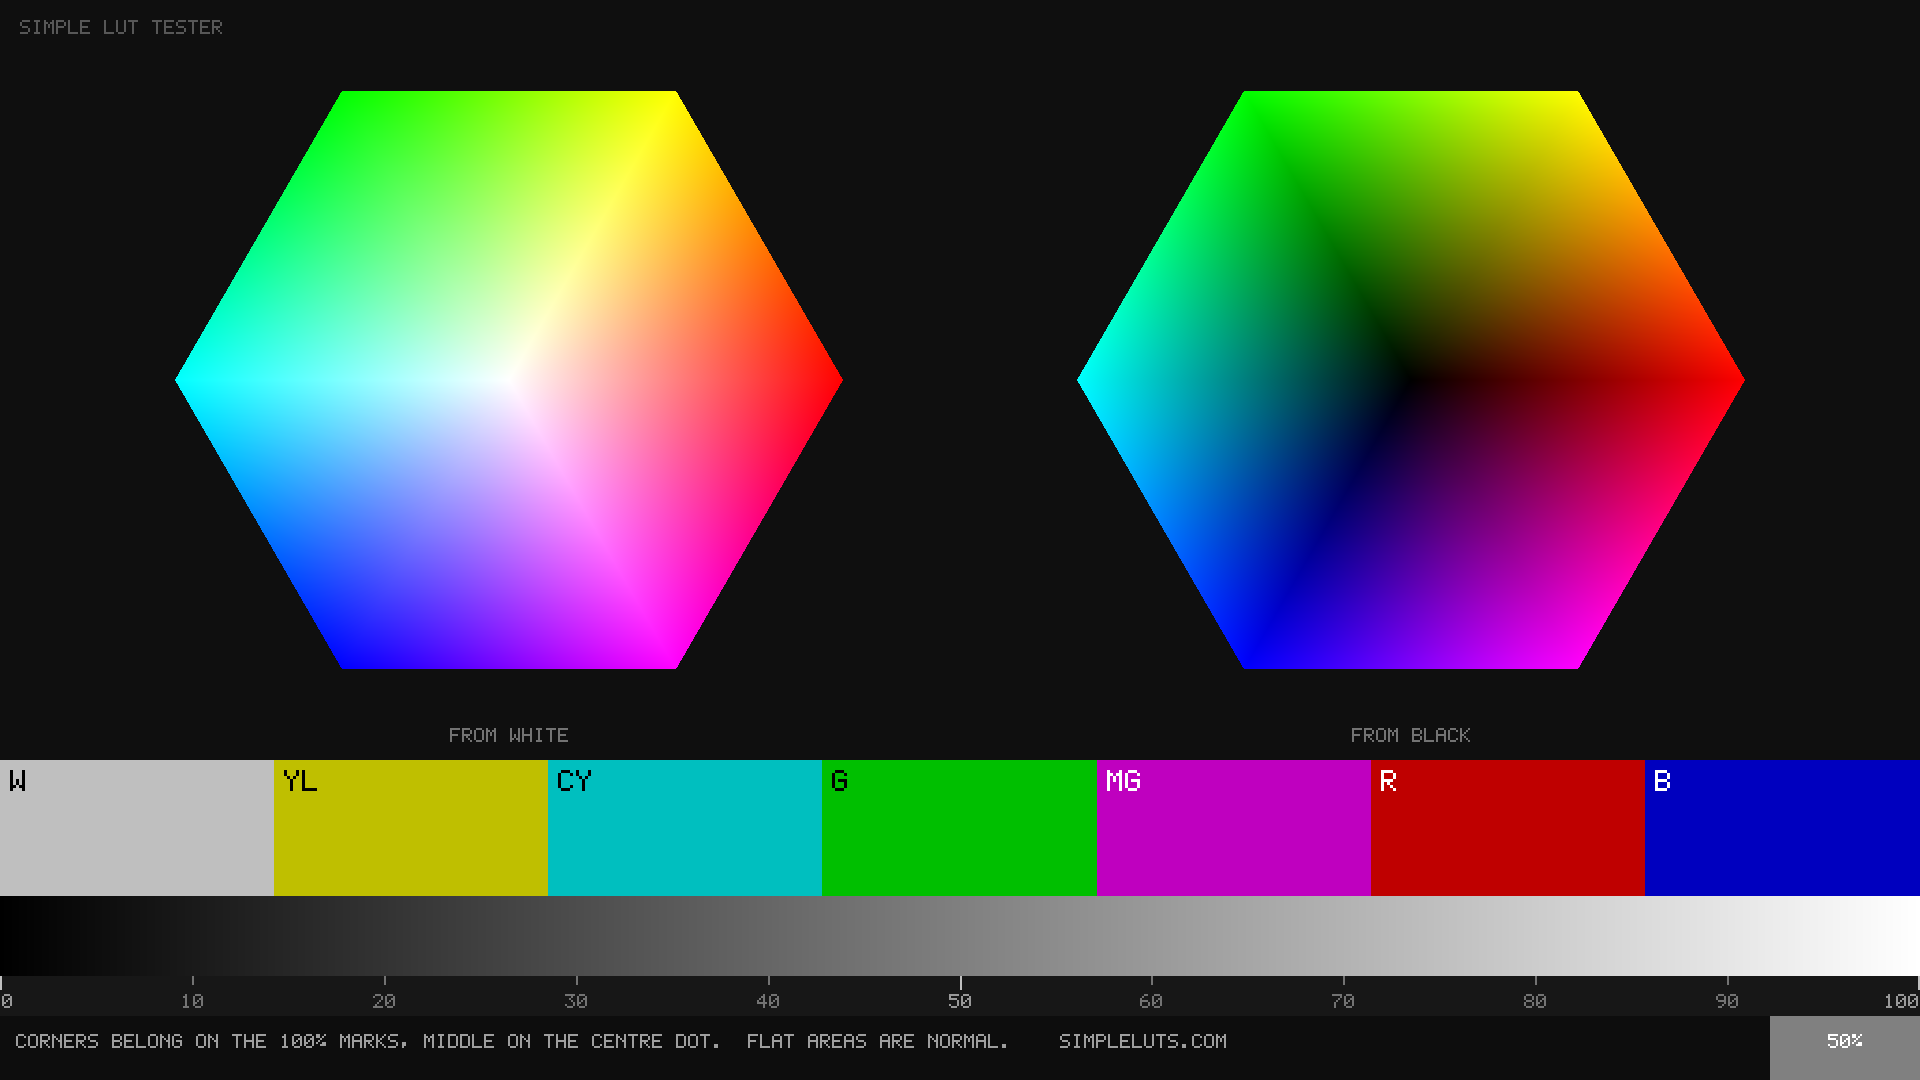
How to use it
Four steps, then one thing to look at.
- Put the PNG on your timeline.
- Apply the LUT you want to test.
- Open your vectorscope.
- Check where the six corners land.
That is the whole method. There is nothing to configure for your camera — the same file works whether you shoot S-Log3, D-Log, Apple Log, V-Log or anything else. Why that works is at the bottom if you are curious, and skippable if you are not.
The good, the bad and the ugly
Three real LUTs, the same chart, the same vectorscope. You are looking at the RGB colour cube from one corner — three faces meeting in the middle. Once you see it as a box rather than a hexagon, the difference between these is not subtle.
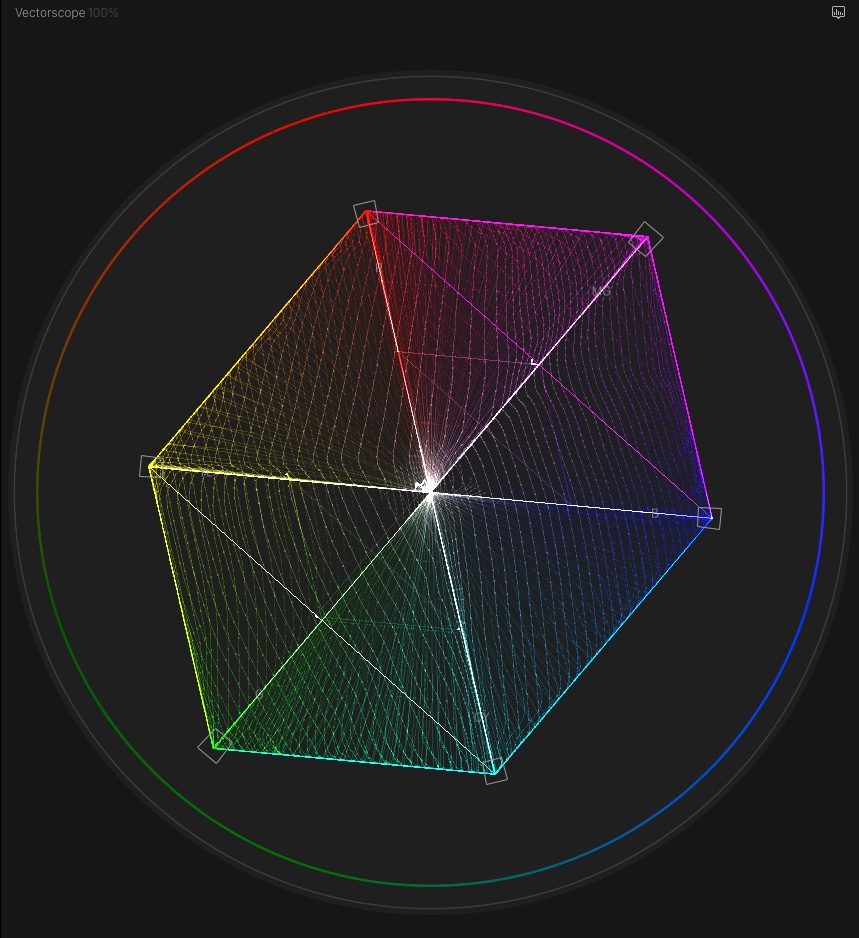
Square and true. Six corners in their boxes, faces even, mesh consistent from centre to edge. Every saturated colour lands where it should.
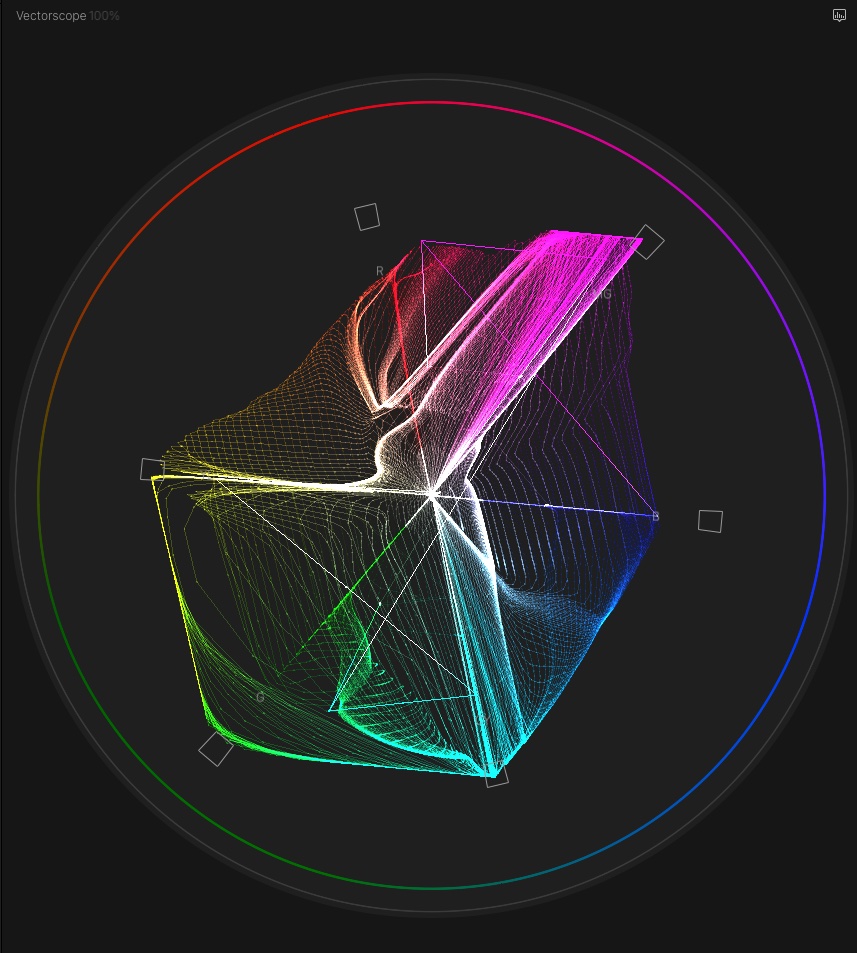
Bent out of square. Still recognisably a cube, but magenta is shoved past its box and the faces bulge. Saturated colour is being pushed somewhere it was never meant to go.
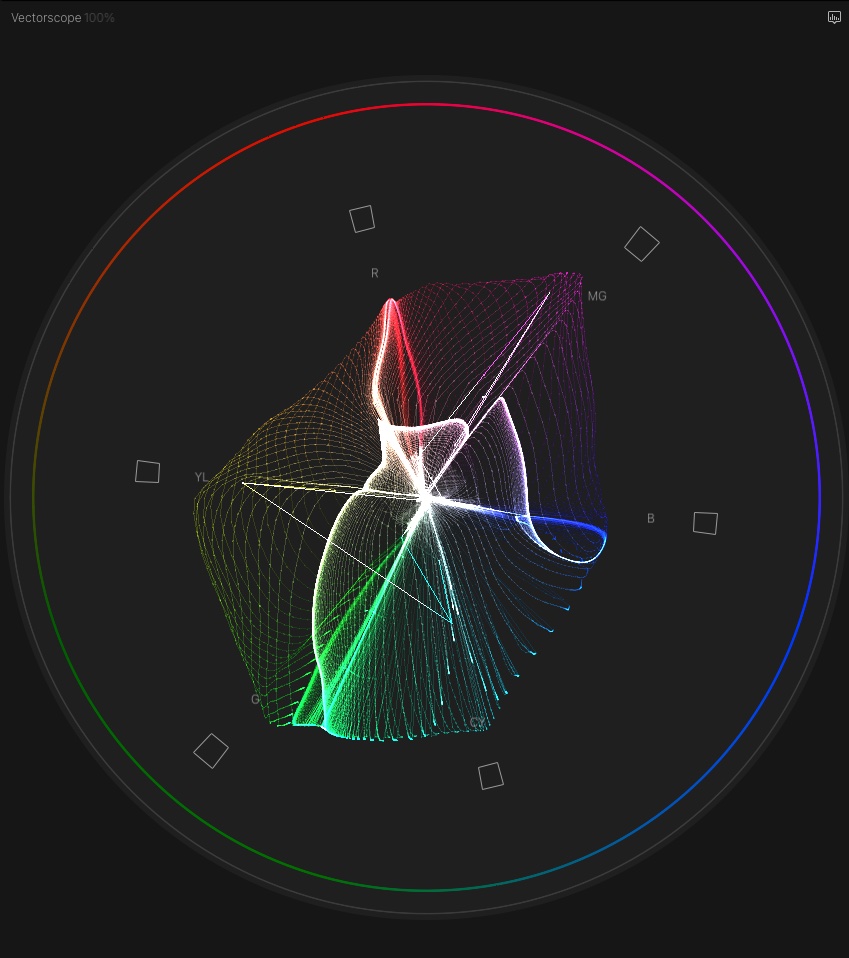
Melted. The cube has collapsed into a fan. Not one corner is near its mark. Nothing in a grade will put this back together.
Reading the shape
- On the marksThe LUT is placing colour where it should.
- RotatedIt is shifting hue across the board.
- Falls shortIt is desaturating.
- Corner flattenedIt is clipping that colour.
- Torn, in ribbonsBadly built. This one is unmistakable.
- Middle off centreYour greys have a colour cast.
A look is allowed to shift hue and saturation a little — that is what a look is. What it is not allowed to do is lose the plot entirely, and that reads at a glance once you know where the corners belong.
What not to read into it
Large flat areas of colour in the hexagons are not a fault. This is worth saying plainly, because it is the obvious thing to assume and it is wrong.
The chart holds the whole range of code values your camera file can contain, including several stops of highlight above diffuse white. Any LUT converting log to Rec.709 has to crush that range into the top few percent of the display — there is nowhere else for it to go. Flat regions are the correct result of that.
Five ways of measuring banding were tested against a correct conversion and a deliberately broken LUT. None separated them, and two ranked the correct one as worse:
| Test | Correct conversion | Broken LUT |
|---|---|---|
| Share of hexagons going flat | 20–30% | 32–42% |
| Distinct output colours | 45% | 48% |
| Tearing under a hard push | +25.4 pts | +17.5 pts |
| Measured inside the cube | ~30% at every depth | — |
| Local gain, slope, resolution | all three trip | all three trip |
The reason is the same every time. A correct log-to-display conversion has to destroy information — seventeen stops squeezed into six. So anything measuring information loss flags it. That is not a measurement waiting to be fixed; it is what the transform is.
Which is why this page tells you to judge placement and nothing else. Judging banding by eye here condemns good LUTs.
Pushing it further
Some faults only appear once you lean on them.
- Raise the gammaHard, and after the LUT. Problems buried in the shadows crawl out.
- Split the channelsLook at red, green and blue on their own. Unevenness in the saturated areas shows there first.
- Under and overGrade the shot a couple of stops either way. A look built by eye on one correctly exposed frame falls apart here.
That last one is the honest test of a LUT you have paid for. A look that only holds together at the exposure it was built at is a look you cannot use.